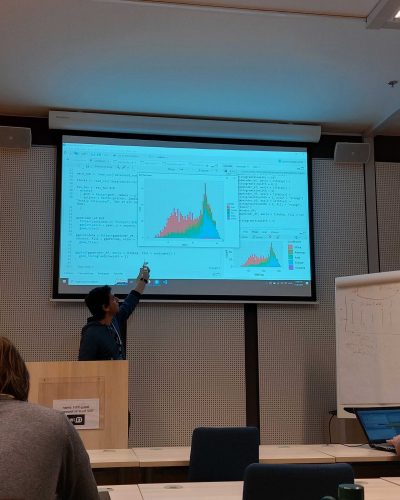
On Tuesday, 8 and 15 November 2022, Ákos Máté held a course entitled Data Visualization in R.
The aim of the course was to provide a practical and interactive overview of data visualization using the ggplot2 package in R.
We covered the basic concepts of data visualization and then put them into practice using different data sources.
The presentation was in Hungarian, the slides were in English.

To provide the best experiences, we use technologies like cookies to store and/or access device information. Consenting to these technologies will allow us to process data such as browsing behavior or unique IDs on this site. Not consenting or withdrawing consent, may adversely affect certain features and functions. For more information about the types of cookies we use and how your data is handled, please refer to our Cookies Notice. To learn more about how we protect your personal information, see our Privacy Policy.